

Which inputs could meaningfully change this forecast?TimeGPT replaces one input at a time with its typical historical value and runs the forecast again. The difference shows how sensitive the model is to that input.
Retail-demand example
We use the same store example as the SHAP guide: 365 days of demand, price, promotion, and temperature, followed by a 14-day forecast.Create the example data
Create the example data
Run the sensitivity analysis
Select the intervention explanation when making the forecast:Summarize the promotion period
The future data contains a seven-day promotion. Average the sensitivity values over those days:
During the promotion period:
- The observed promotion raises the model forecast by about one unit compared with a typical promotion value.
- The observed price lowers it by about one unit compared with the store’s historical average price.
- The observed temperature lowers it by about 0.63 units compared with the historical average temperature.
See how sensitivity changes by day
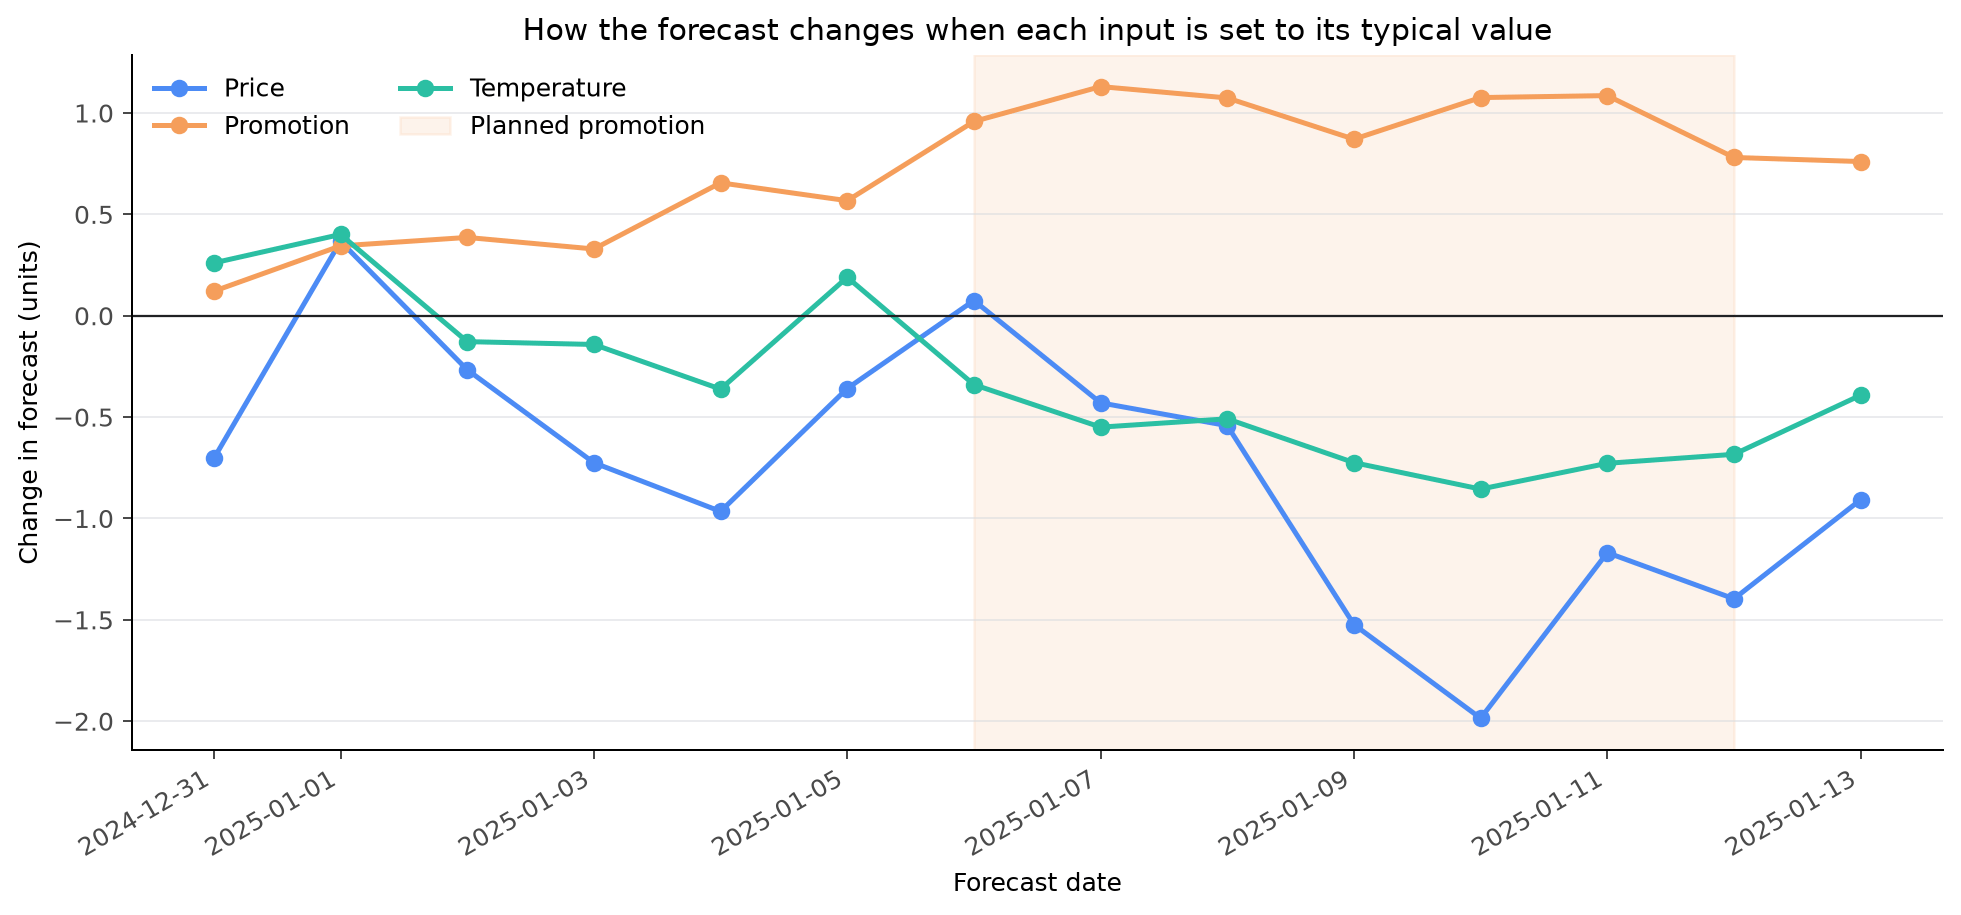
Each line shows the difference between the observed-input forecast and the forecast with that input set to its typical value. Results were generated with TimeGPT 2.1.
When to use intervention
Intervention explanations are helpful when:- A forecast changes after new price, weather, or campaign information arrives.
- You want to compare the model forecast with a familiar historical reference.
- You need to identify forecast inputs worth reviewing with a domain expert.